Blog: Don’t Forget About Supply


With national multifamily deliveries hitting 50 year highs, many operators and developers are questioning whether or not current and future values are defensible due to operational and capital market headwinds in the current environment. Rising supply and demand imbalances pose a a threat to revenues, collections, and occupancy levels. Many growth markets are experiencing 20-year high supply deliveries which will temporarily soften tenant absorption and therefore revenue + property values. High supply and a weaker consumer will drive lower occupancy, rents, and higher concessions until the new supply is absorbed. Once it is, we should be trending back to a normalized annual rent growth environment on average, in positive net migration markets.

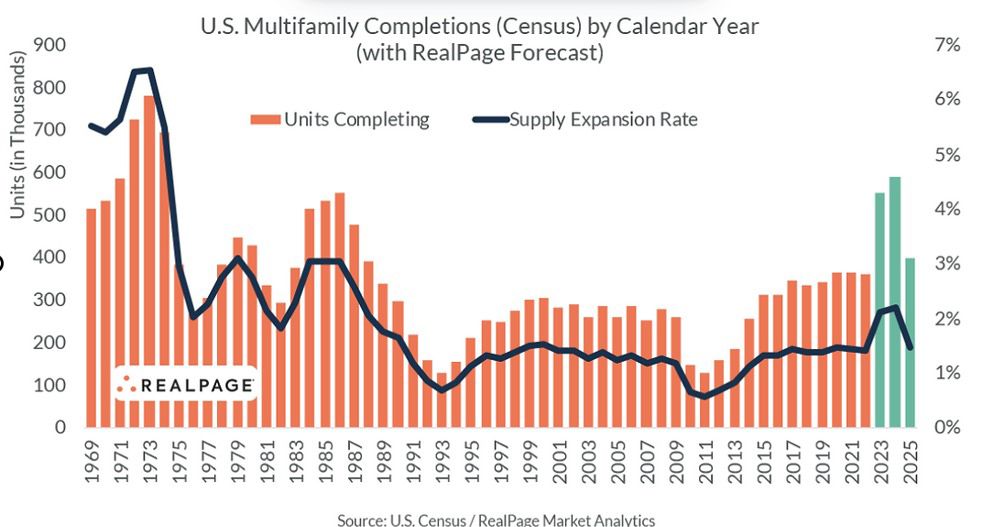
U.S. Census/RealPage Market Analytics

Although on an absolute basis, deliveries are hitting 50-year highs, it is more important to consider the relative supply expansion rate. Our country is still short on rental units, and the recent exorbitant spike in debt financing will likely weigh on new deliveries from 2025 and onward. Taking the news headlines at face value could lead to missing out on a functionally advantaged time to develop. Demographically, our country looks a lot different than it did in the 70s and 80s. Today's developers are delivering units to a much larger pool of renters. As a result, lease up distress will hit markets much more selectively, depending on the relative expansive rates and employment strength in each market.


How do developers know when to stop developing? Developers are usually solving for a 30%+ gross margin on new projects. Typically developers will overdevelop a submarket/market due to the lag between pre-development/entitlements and lease ups. As everyone wants to participate in an area's rapid growth, developers all race to bring units online at the same time, usually resulting in a cascade of oversupply, triggering a local market down cycle once absorption (growth) taps out. More supply will force competitors to lower rents, leading to falling revenue, decreased NOI, and lower property values. Once the math breaks and projected profit becomes too thin - developers will halt new projects. So what's in the 30% margin? To calculate that margin or profit, developers need to quantify their all in costs and their end value.


Construction pricing is the largest input in determining replacement costs for real assets. Replacement cost analysis is an important fundamental to understand as it generally sets the value for new core assets, thereby affecting asset values down the property grade chain. From 2018 and onward, apartment pricing for older assets began to skyrocket, climbing above replacement cost for buildings built between 2000 and 2020, by as much as 20-30% in some cases. The market was over-valuing these assets. It doesn't make sense to pay a higher price for an older asset if you can build it for cheaper.


Generally, investors require a discount to replacement cost for existing assets that is commensurate with the added risk and capital outlay these older buildings require to service, maintain, and keep full. This inflated pricing dislocation was a reflection of hot demand and rental growth, lots of capital, and cheap debt, compressing cap rates and pushing values to record-breaking highs.


Another forward looking indicator for over-valuations is the cap rate spread across same property type asset grades. Typically, apartments trade at a 200-400 basis point spread from A-D asset classes, with nicer assets located in the best areas commanding the lowest cap rates and vice versa. Over the past couple of years, however, that spread narrowed to near 0 in the hottest markets in the country, an indication of broken fundamentals and overly-eager underwriting expectations. These lower quality assets are likely to see a harder hit to their valuations than their counterparts until they revert to their mean values.


Because existing assets were overpriced and buyers were willing to pay up to 30% over replacement cost, the ball has been in the developers court these past few years. Developers could command anywhere from 30-50%+ gross margins on projects, fueled by an expansive, low rate debt environment allowing these buyers to solve for an abnormally low WACC and resulting high price. Gone are the days of 5,000 year interest rate lows.


Let's take a look at some of the leading indicators driving the cost for new construction to better understand what drives pricing.


1) Energy

Petroleum is the most important input cost for all of our finished goods since these goods require energy to transport and build them. Construction is no different. Hydro carbons/oil have dominated the world energy game fueling growth and productivity over the last couple hundred years. As global energy trade and production shifts significantly, we are likely to see more volatility and higher costs. Higher energy costs means higher pricing for goods and services as these costs are passed down to the consumer.


2) AIA/Deltek Architecture Billings Index (ABI)

This index tracks the demand for architectural services, a leading indicator for construction projects. A score below 50 translates to less demand than the prior period, and a score higher than 50 translates to more demand than the prior period.


3) Steel, Lumber, Concrete, Copper

These are the most common raw commodity inputs for construction projects forming the structure and electrical components of buildings.


4) Associated Builders And Contractors Indexes (ABC)

ABC is a national construction trade association and tracks construction sentiment through indexes and reports such as the construction backlog indicator.


5) US Census Bureau Construction Spending Data

This data breaks down national construction activity by product and industry type. Although it is lagging, it is reliable reflection of trends and future sentiment for the industry.


6) Producer Price Index (PPI)

A bundle of indexes that measures price movement from the seller's perspective. The U.S. Bureau of Labor Statistics has a specialized graph that tracks construction specific data. See chart below.

By Christian O'Neal June 24, 2025
In the world of capital markets, clarity is often fleeting — and today, it feels downright elusive. The Federal Reserve’s latest June dot plot offered little in the way of certainty. While the median projection sees the Federal Funds Rate in the mid-3% range by the end of 2026 , the dispersion among voting members is striking. Seven members predict no rate cuts in 2024 , reflecting just how divided the committee remains in the face of conflicting data. This latest update marks a 25-50 basis point shift downward from May , but the overarching theme is one of caution, not conviction. That sentiment is mirrored in the economic projections. Core PCE inflation , the Fed’s preferred inflation measure, is now expected to end 2025 at 3.0% , 30 basis points higher than earlier forecasts. Meanwhile, real GDP is forecast to slow from 2.3% in Q4 2024 to just 1.7% in 2025 — another sign that the lagged effects of monetary policy are expected to begin to show. At the same time, the Fed’s balance sheet has shrunk dramatically, from a peak of $9 trillion in April 2022 to just $2.3 trillion today . That quantitative tightening, coupled with a lack of consistent inflation suppression, leaves both equity and bond markets vulnerable to further volatility. This all feeds into an uncomfortable truth: rates are likely to remain higher for longer , and the market is struggling to price that reality. The VIX index , a 30-day forward-looking gauge of volatility in equities, is trending higher. When volatility rises even as indices fall, credit spreads widen , liquidity tightens, and financing risk surges. For commercial real estate investors , this has enormous implications. As we explored in our recent article on CRE Price Discovery , the market remains in flux. The bid-ask spread in real estate is still somewhat wide, and most transaction activity today is being driven by maturing debt — not opportunistic investments banking on future growth. This means valuations are being forced downward, especially for assets that were purchased or refinanced at ultra-low rates in 2021–2022. Consumer behavior is also in transition. Household formation is slowing, and personal savings rates are slowly ticking up although they are significantly down from longer term averages – which could reflect folks bracing for economic turbulence. U.S. household formation currently stands at 1.058 million, down 7.68% from last month’s 1.146 million and down 47.73% from 2.024 million a year ago. Looking globally, demand for U.S. Treasuries remains a critical economic indicator that has trickling effects on the economy . A strong bid-to-cover ratio — like the 2.67x seen at the June 11th 10-Year Treasury auction , with nearly 88% of bids from foreign banks — is encouraging. It suggests continued faith in U.S. fiscal credibility and currency strength despite market apprehensions in our strength, such as the US credit rating being downgraded by Moody’s. This equilibrium is rather fragile. Should the U.S. continue to run massive budget deficits with a debt-to-GDP ratio north of 120% , investors may begin to demand higher yields — or worse, seek refuge in alternative stores of value. Gold is one such store. The World Gold Council recently reported that 76% of central banks expect to increase their gold holdings over the next five years , up from 69% in 2023. This flight to real assets reflects growing concern about the long-term value of fiat currencies — and a desire to hedge against systemic risk. The Bottom Line  Rates are likely to remain high through 2025 and into 2026 Inflation remains persistent but progress has been unclear Growth is slowing, and volatility is rising Real estate is repricing around debt maturity events Global capital is shifting cautiously, looking for safety At Alpha Equity Group, we believe this is a time for discipline, not risk-taking. We’re staying patient, watching the data, and investing defensively — focusing on secured debt positions and capital preservation. While others chase uncertain upside, we’re building long-term value through downside protection while we wait out the convergence of dozens of factors completely outside our control.
By Christian O'Neal June 24, 2025
When markets break from fundamentals, the prudent real estate investor doesn’t chase noise — they reposition around truth. And the truth is this: we are entering a prolonged period of macroeconomic and geopolitical volatility . The world is realigning, and capital is responding accordingly. Global central banks are moving away from the U.S. dollar. According to the World Gold Council, 76% of central banks plan to increase their gold reserves — a jump from 69% last year — citing crisis protection, inflation hedging, and diversification as key drivers. This reflects a growing caution around U.S. fiscal policy , rising deficits , and ballooning national debt , now over 120% of GDP . Meanwhile, money market fund balances are climbing — a signal that institutional and retail investors alike are parking cash on the sidelines. These short-term investment vehicles offer safety and a yield that closely tracks the Fed Funds Rate. In other words, investors would rather earn 5% in cash than take risk in longer-duration assets, treasuries, or swinging equities. These trends are further complicated by geopolitical uncertainty. Ongoing wars, potential tariff escalations , and questions around U.S. fiscal leadership all introduce headline risk. Should unemployment rise , or growth falter , the Fed may face pressure to intervene — but its tools are limited. Cutting rates could re-ignite inflation. Raising taxes or cutting spending is politically unpopular. The Fed is cornered, managing debt service costs, inflation expectations, and political realities simultaneously. For CRE investors, this creates both risk and opportunity. Real estate pricing is driven by capital flows, leverage, and the cost of debt . When long-term Treasury rates rise , the “risk-free rate” increases — and with it, lenders widen their spreads to reflect perceived risk. Even when treasuries fall, spreads going higher can keep all-in interest rates higher. Spreads are higher for construction loans, transitional assets, and tertiary market, reflecting in lower asset prices. The net effect is simple: lower loan proceeds and higher cost of capital . As a result, buyers must lower offers to meet equity return thresholds . We are already seeing this play out in real time. In markets where price discovery is finally happening , bids are falling, and assets are being marked to market — especially those with near-term debt maturities. Until this repricing completes and stability returns, we believe it is wise to lean into debt rather than chase speculative equity returns. Debt Offers Strategic Advantages Right Now: Senior positioning in the capital stack offers downside protection Current yields are attractive , often exceeding return thresholds without relying on appreciation Shorter durations allow us to stay nimble as the market evolves And we can structure loans with sponsor-friendly terms , aligning ourselves with developers who need flexible capital during this transition period At Alpha Equity Group, we’re also putting our own capital to work on the equity side of the deals we know best — infill residential development. But we are doing so carefully, underwriting with stress-tested assumptions, and leaning on our operational expertise. As we’ve seen in prior cycles, market dislocation creates fertile ground for investors . With uncertainty around every corner, we see this moment not as a challenge, but as an opening — a window to preserve capital, generate yield, and position for long-term outperformance once growth does come back. What to Watch: The yield curve : steepening curves may signal higher inflation and longer-term rate risk U.S. bond auctions : demand strength, especially from foreign investors, impacts long-term borrowing rates. The US is expected to start buying treasuries and bonds again in 2026, increasing its balance sheet again after rounds of tightening alongside the recent rate hike cycle. Credit spreads : widening spreads reflect rising risk aversion and lender caution Geopolitical escalation : new conflicts or trade wars can drive capital away from U.S. assets and toward gold or other alternatives Fiscal response : keep an eye on Trump-era tax reform 2.0, tariffs, or large-scale spending plans heading into the election cycle. This can affect bets on future inflation, bonds, capital availability, and CRE prices. In short, we are in a time of reordering — politically, economically, and monetarily. Investors who embrace this shift and position accordingly will be well-rewarded. We’re not just investing in the market we have — we’re preparing for the one that’s coming.  That’s why we’re taking a conservative credit-first approach , with upside optionality where it makes sense, and defense where it matters most.
By Christian O'Neal May 27, 2025
Multifamily Housing and Risk-Adjusted Returns
Show More